More students involved.
Every school, one clear view.
Involve helps students find and join the clubs your schools already offer, then turns what happens inside them into participation data your district can finally see.
Sets up with your school accounts Screens show sample data
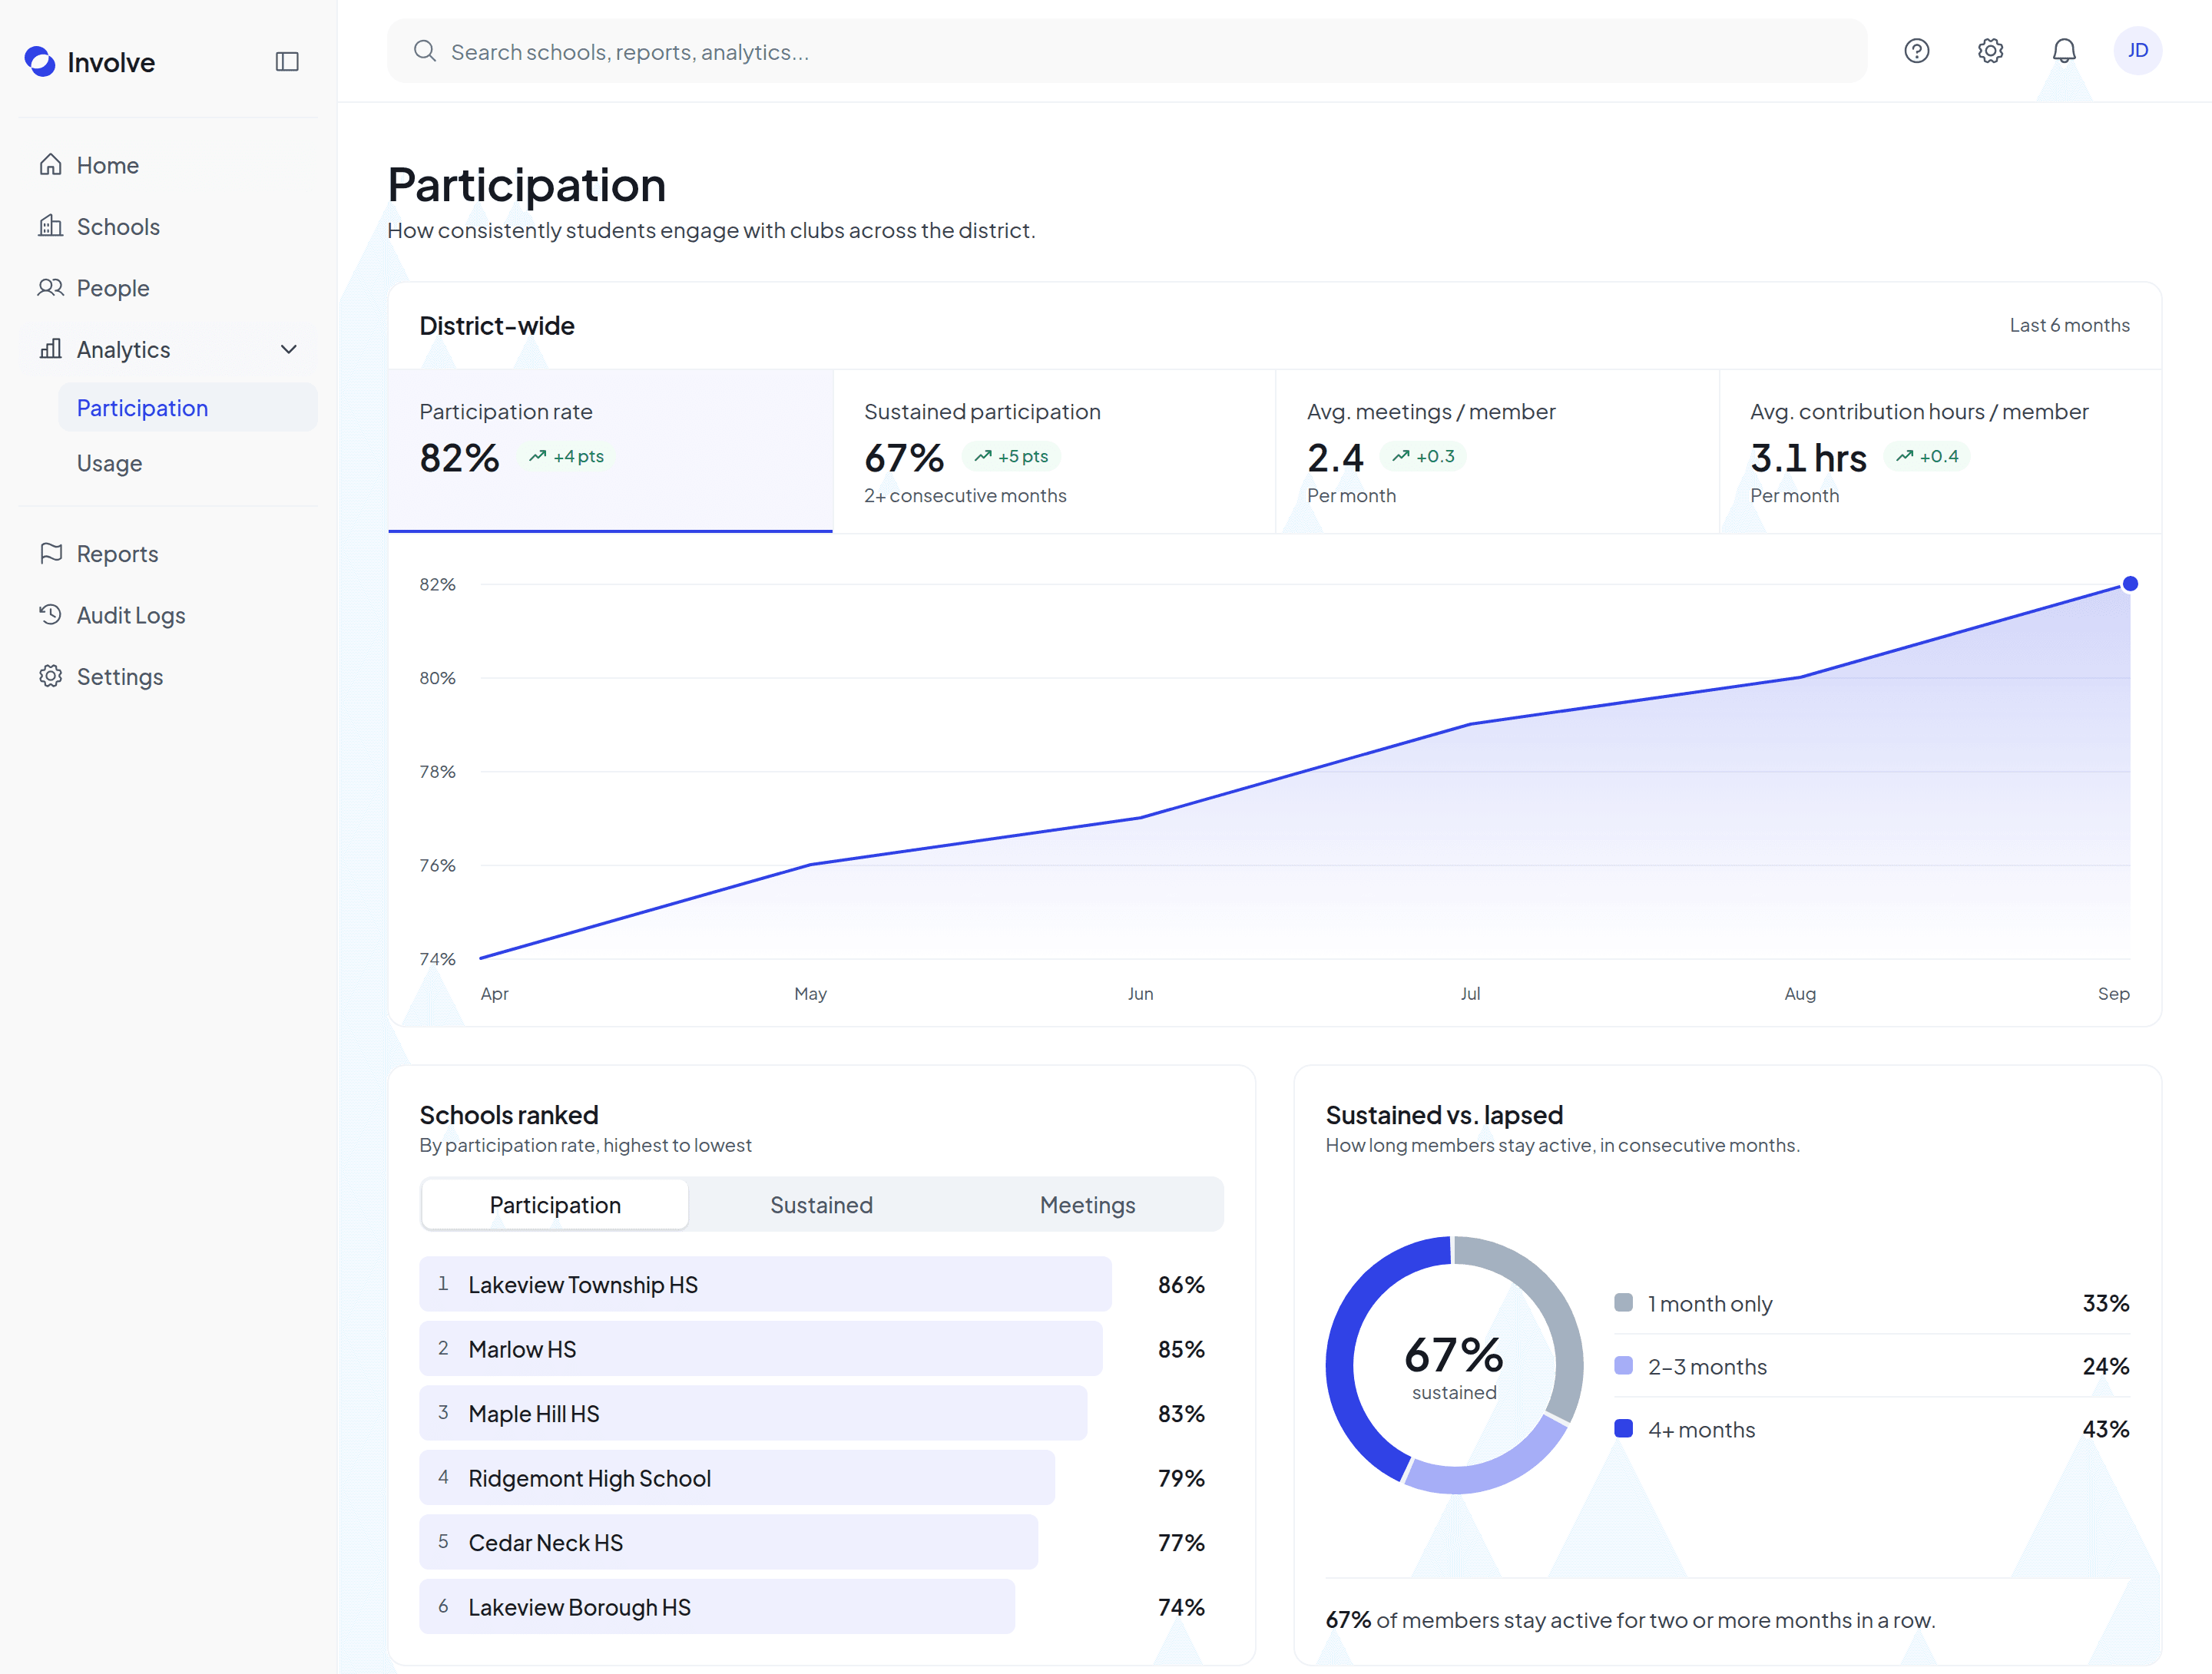
Know who’s involved, how deeply, and for how long.
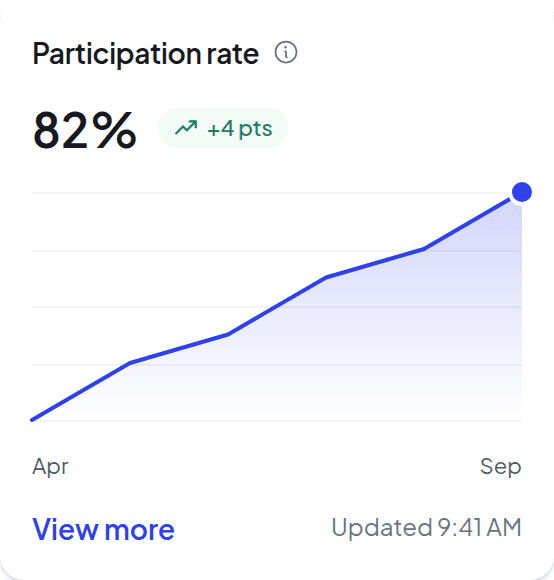
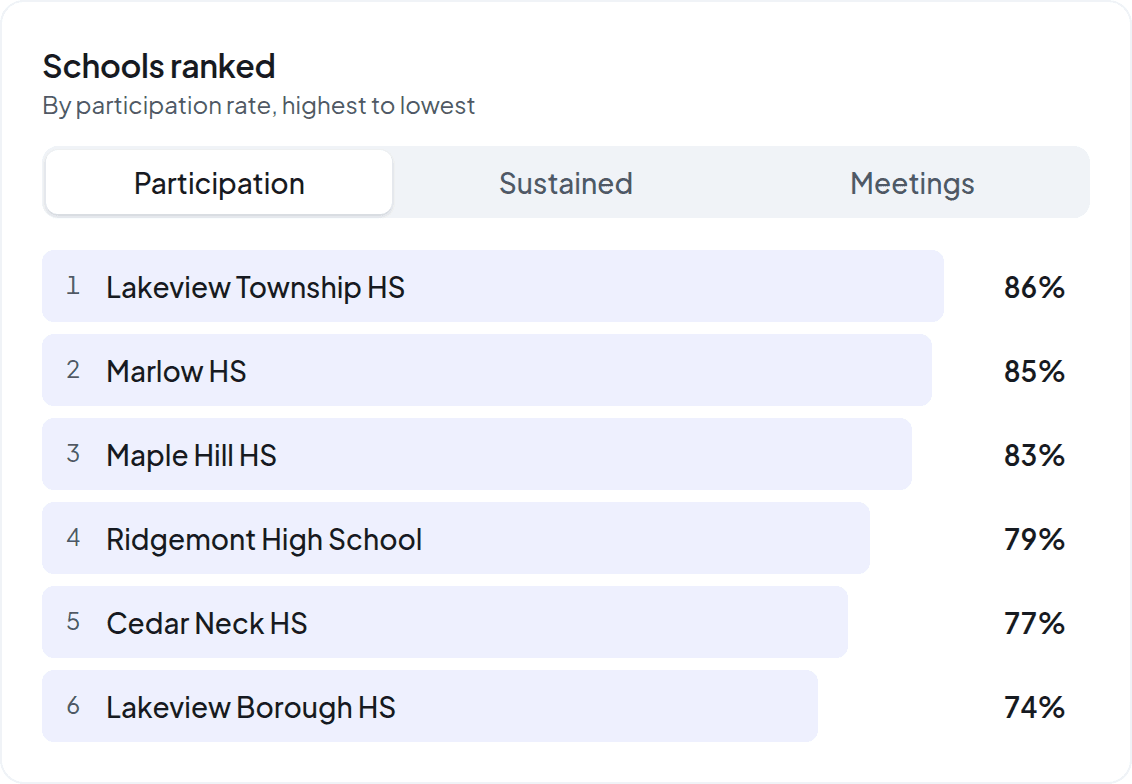
Who is taking part, not just who joined. See your participation rate by school, and how it’s moving over time.
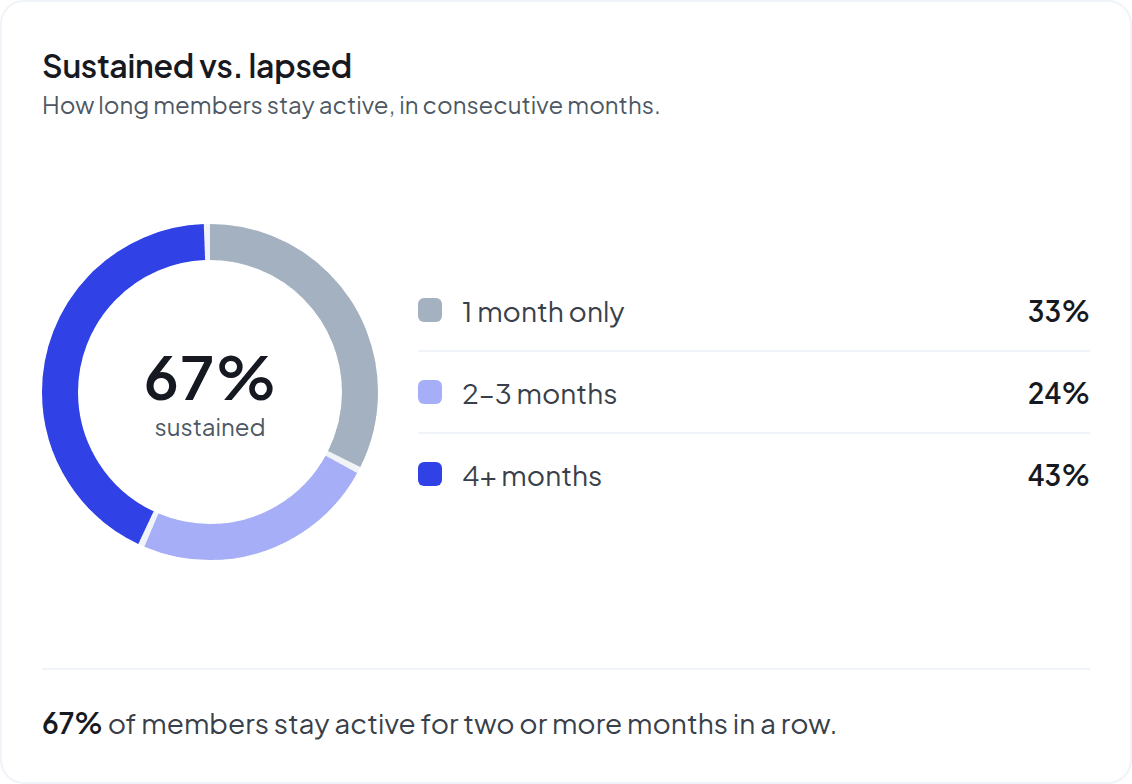
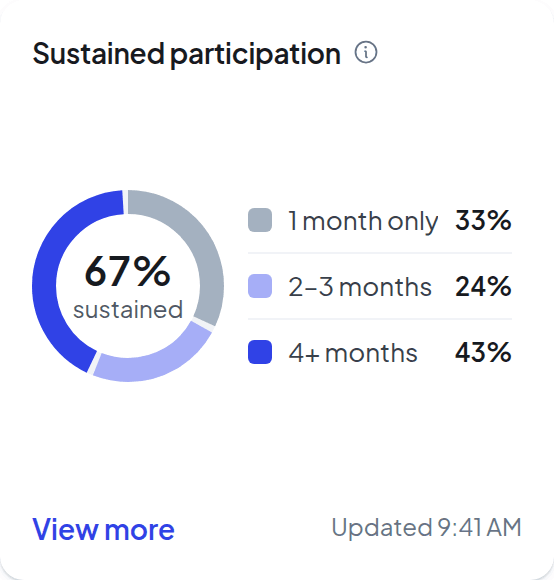
See how long members stay active: how many drop off after a month, and how many are still showing up four months in.
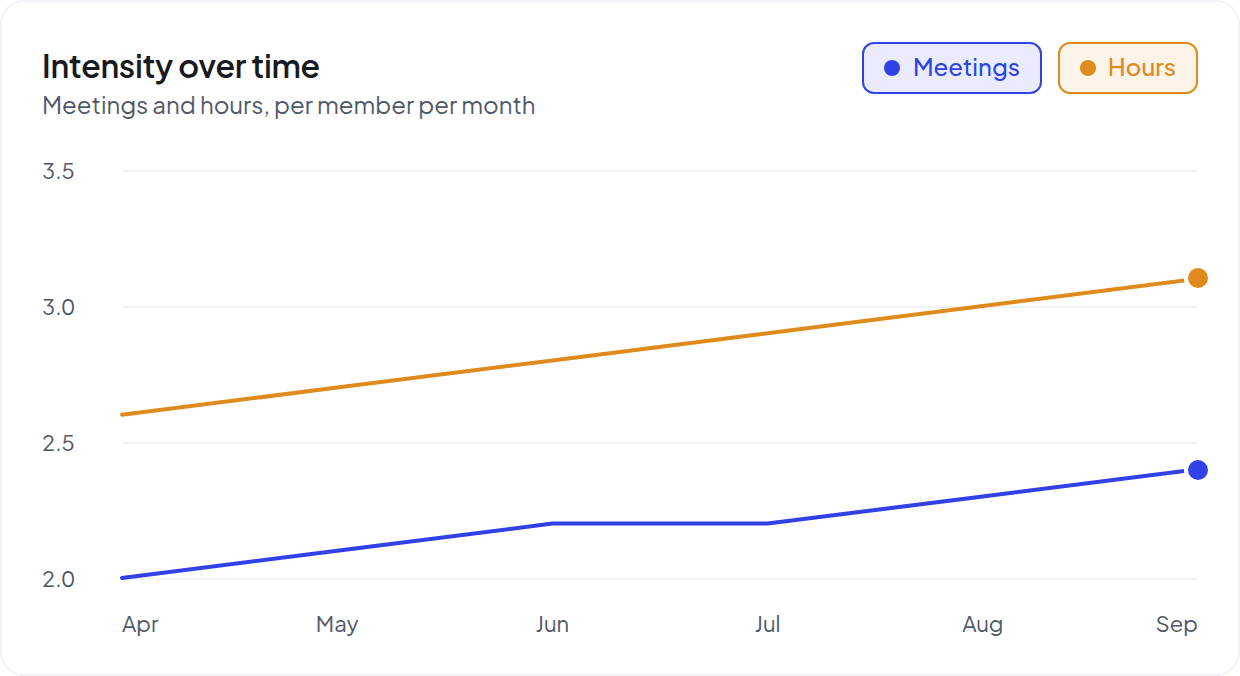
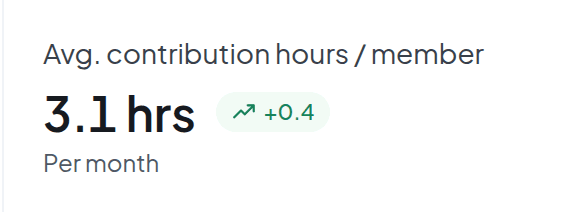
Meetings and contribution hours per member, month by month, recorded by the advisors who run each club.

Every school, one place
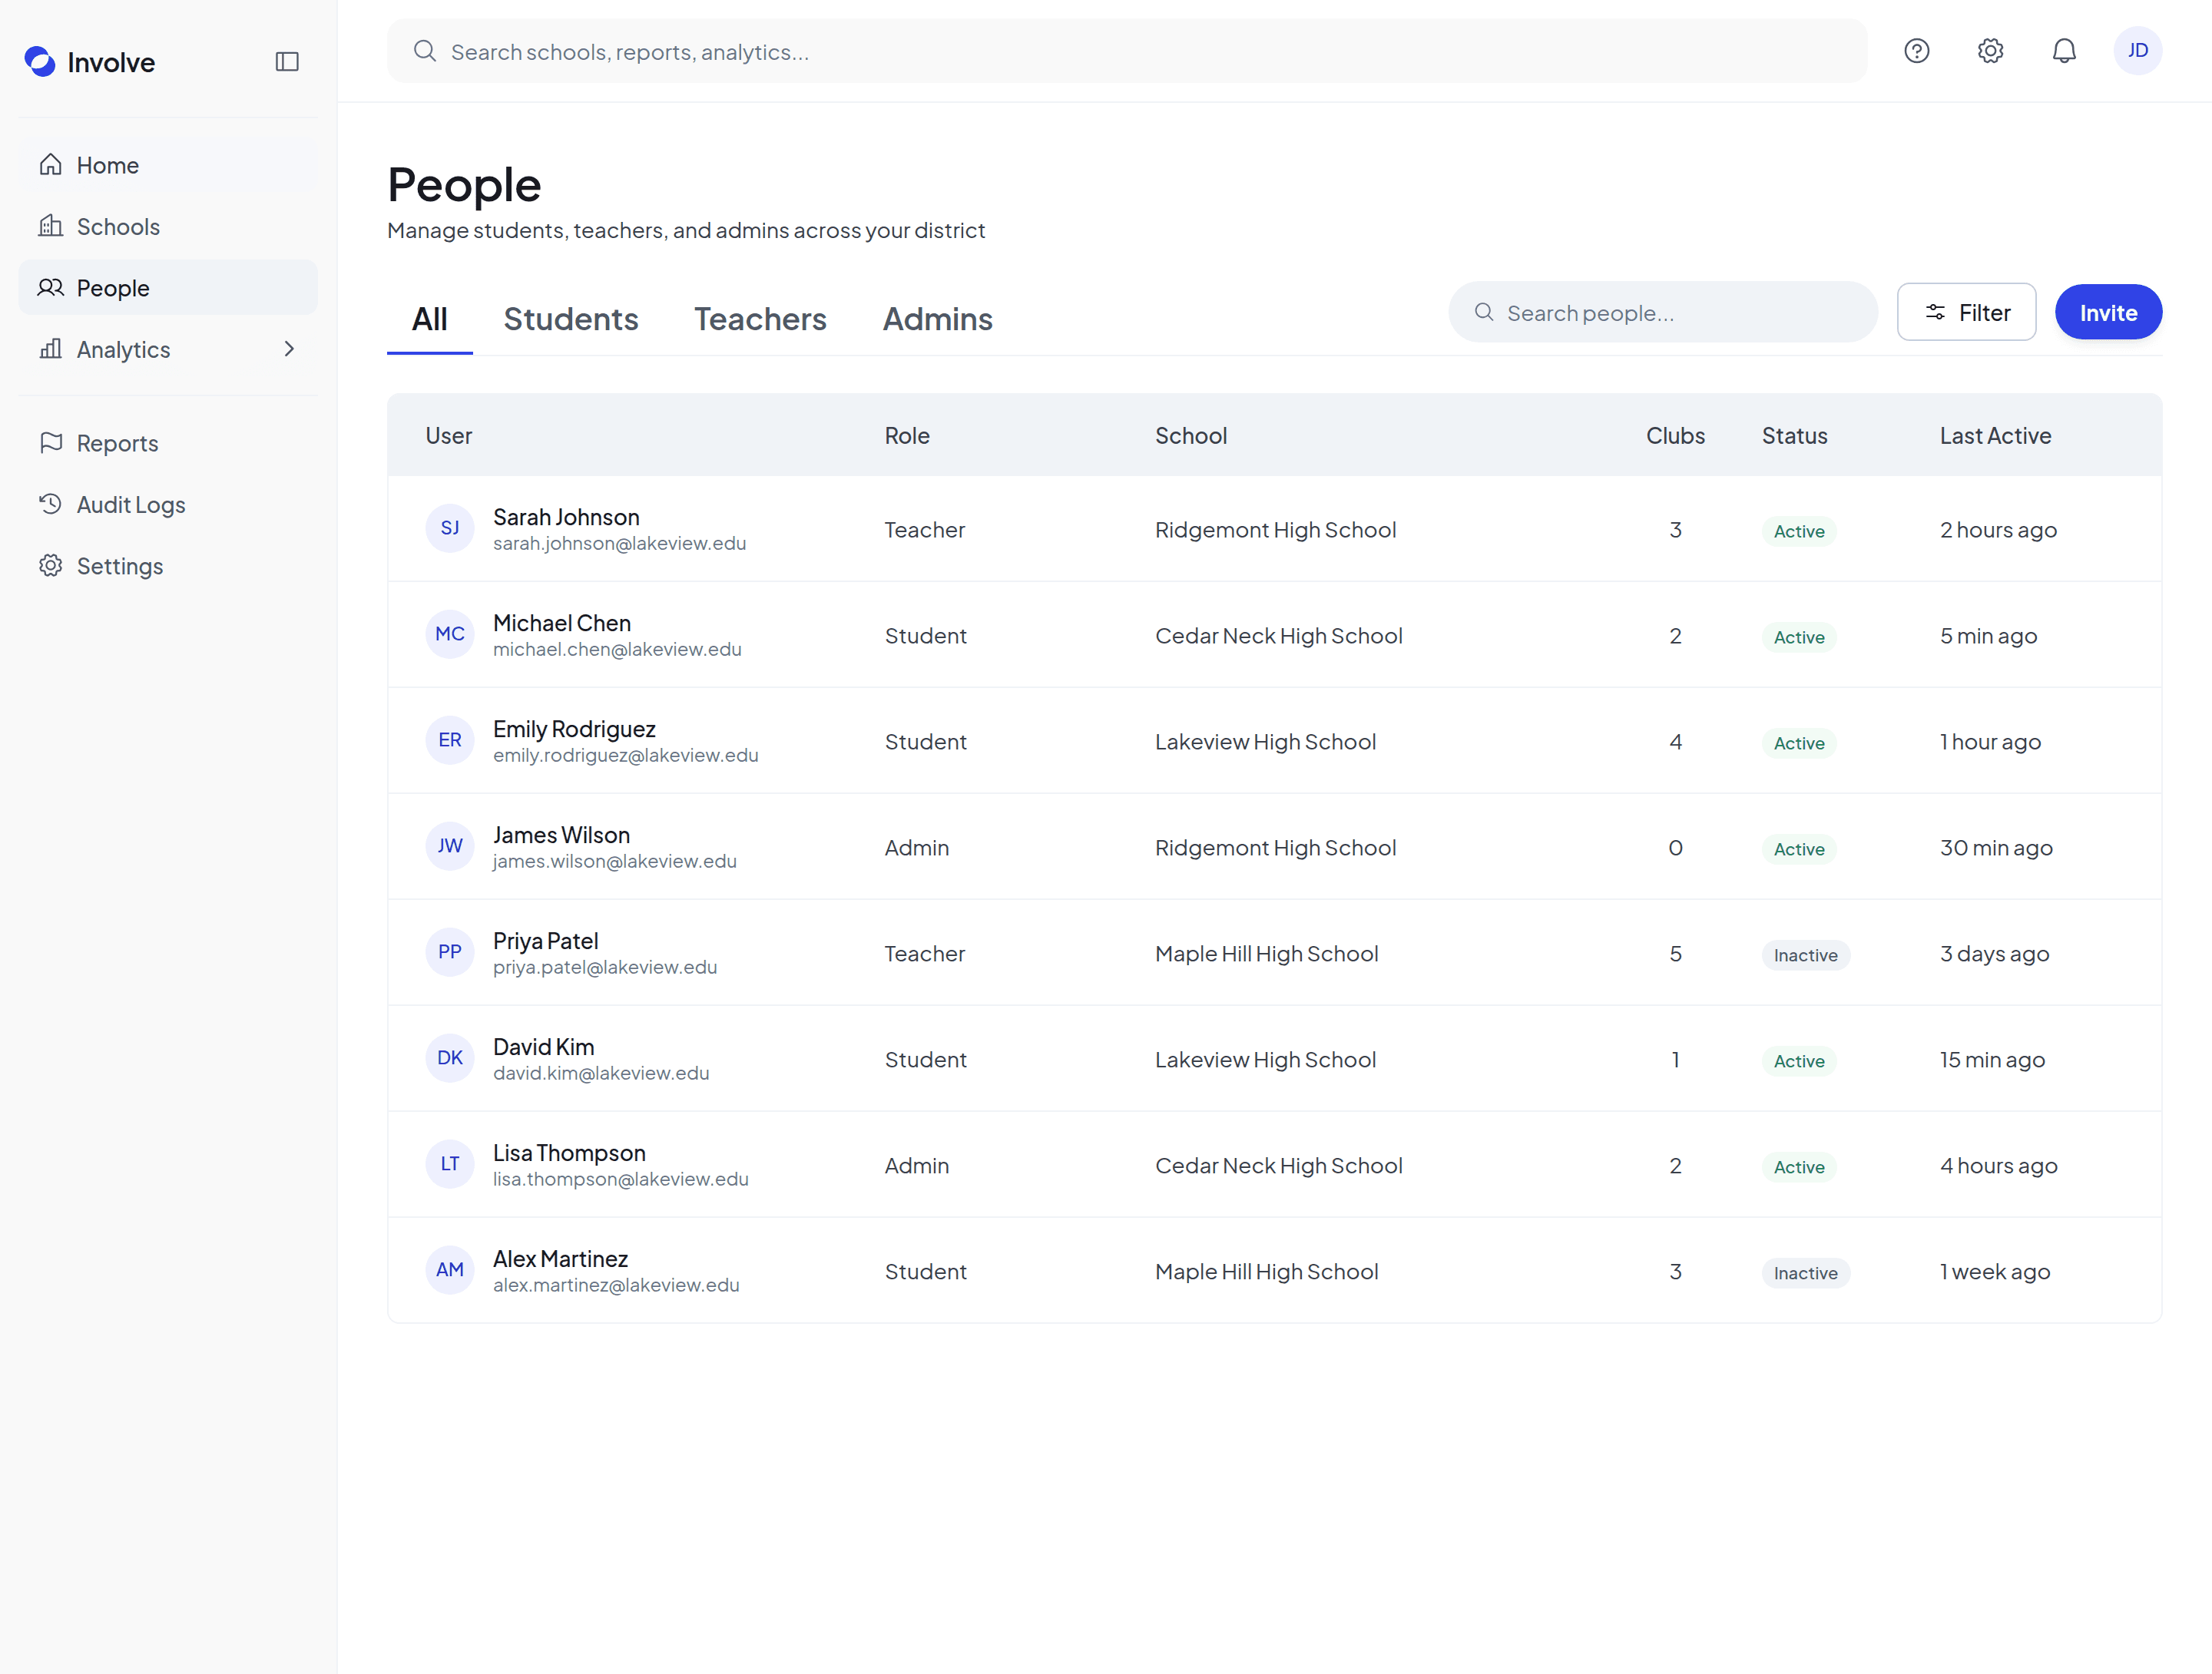
Connect your school accounts and your schools, their clubs and their people show up together. See each school’s activity without asking anyone for a report.
See whether it’s actually being used.
Active members, advisors and clubs across the district, plus how much your schools are posting, announcing and meeting, so you know where adoption is strong and where a school could use a hand.
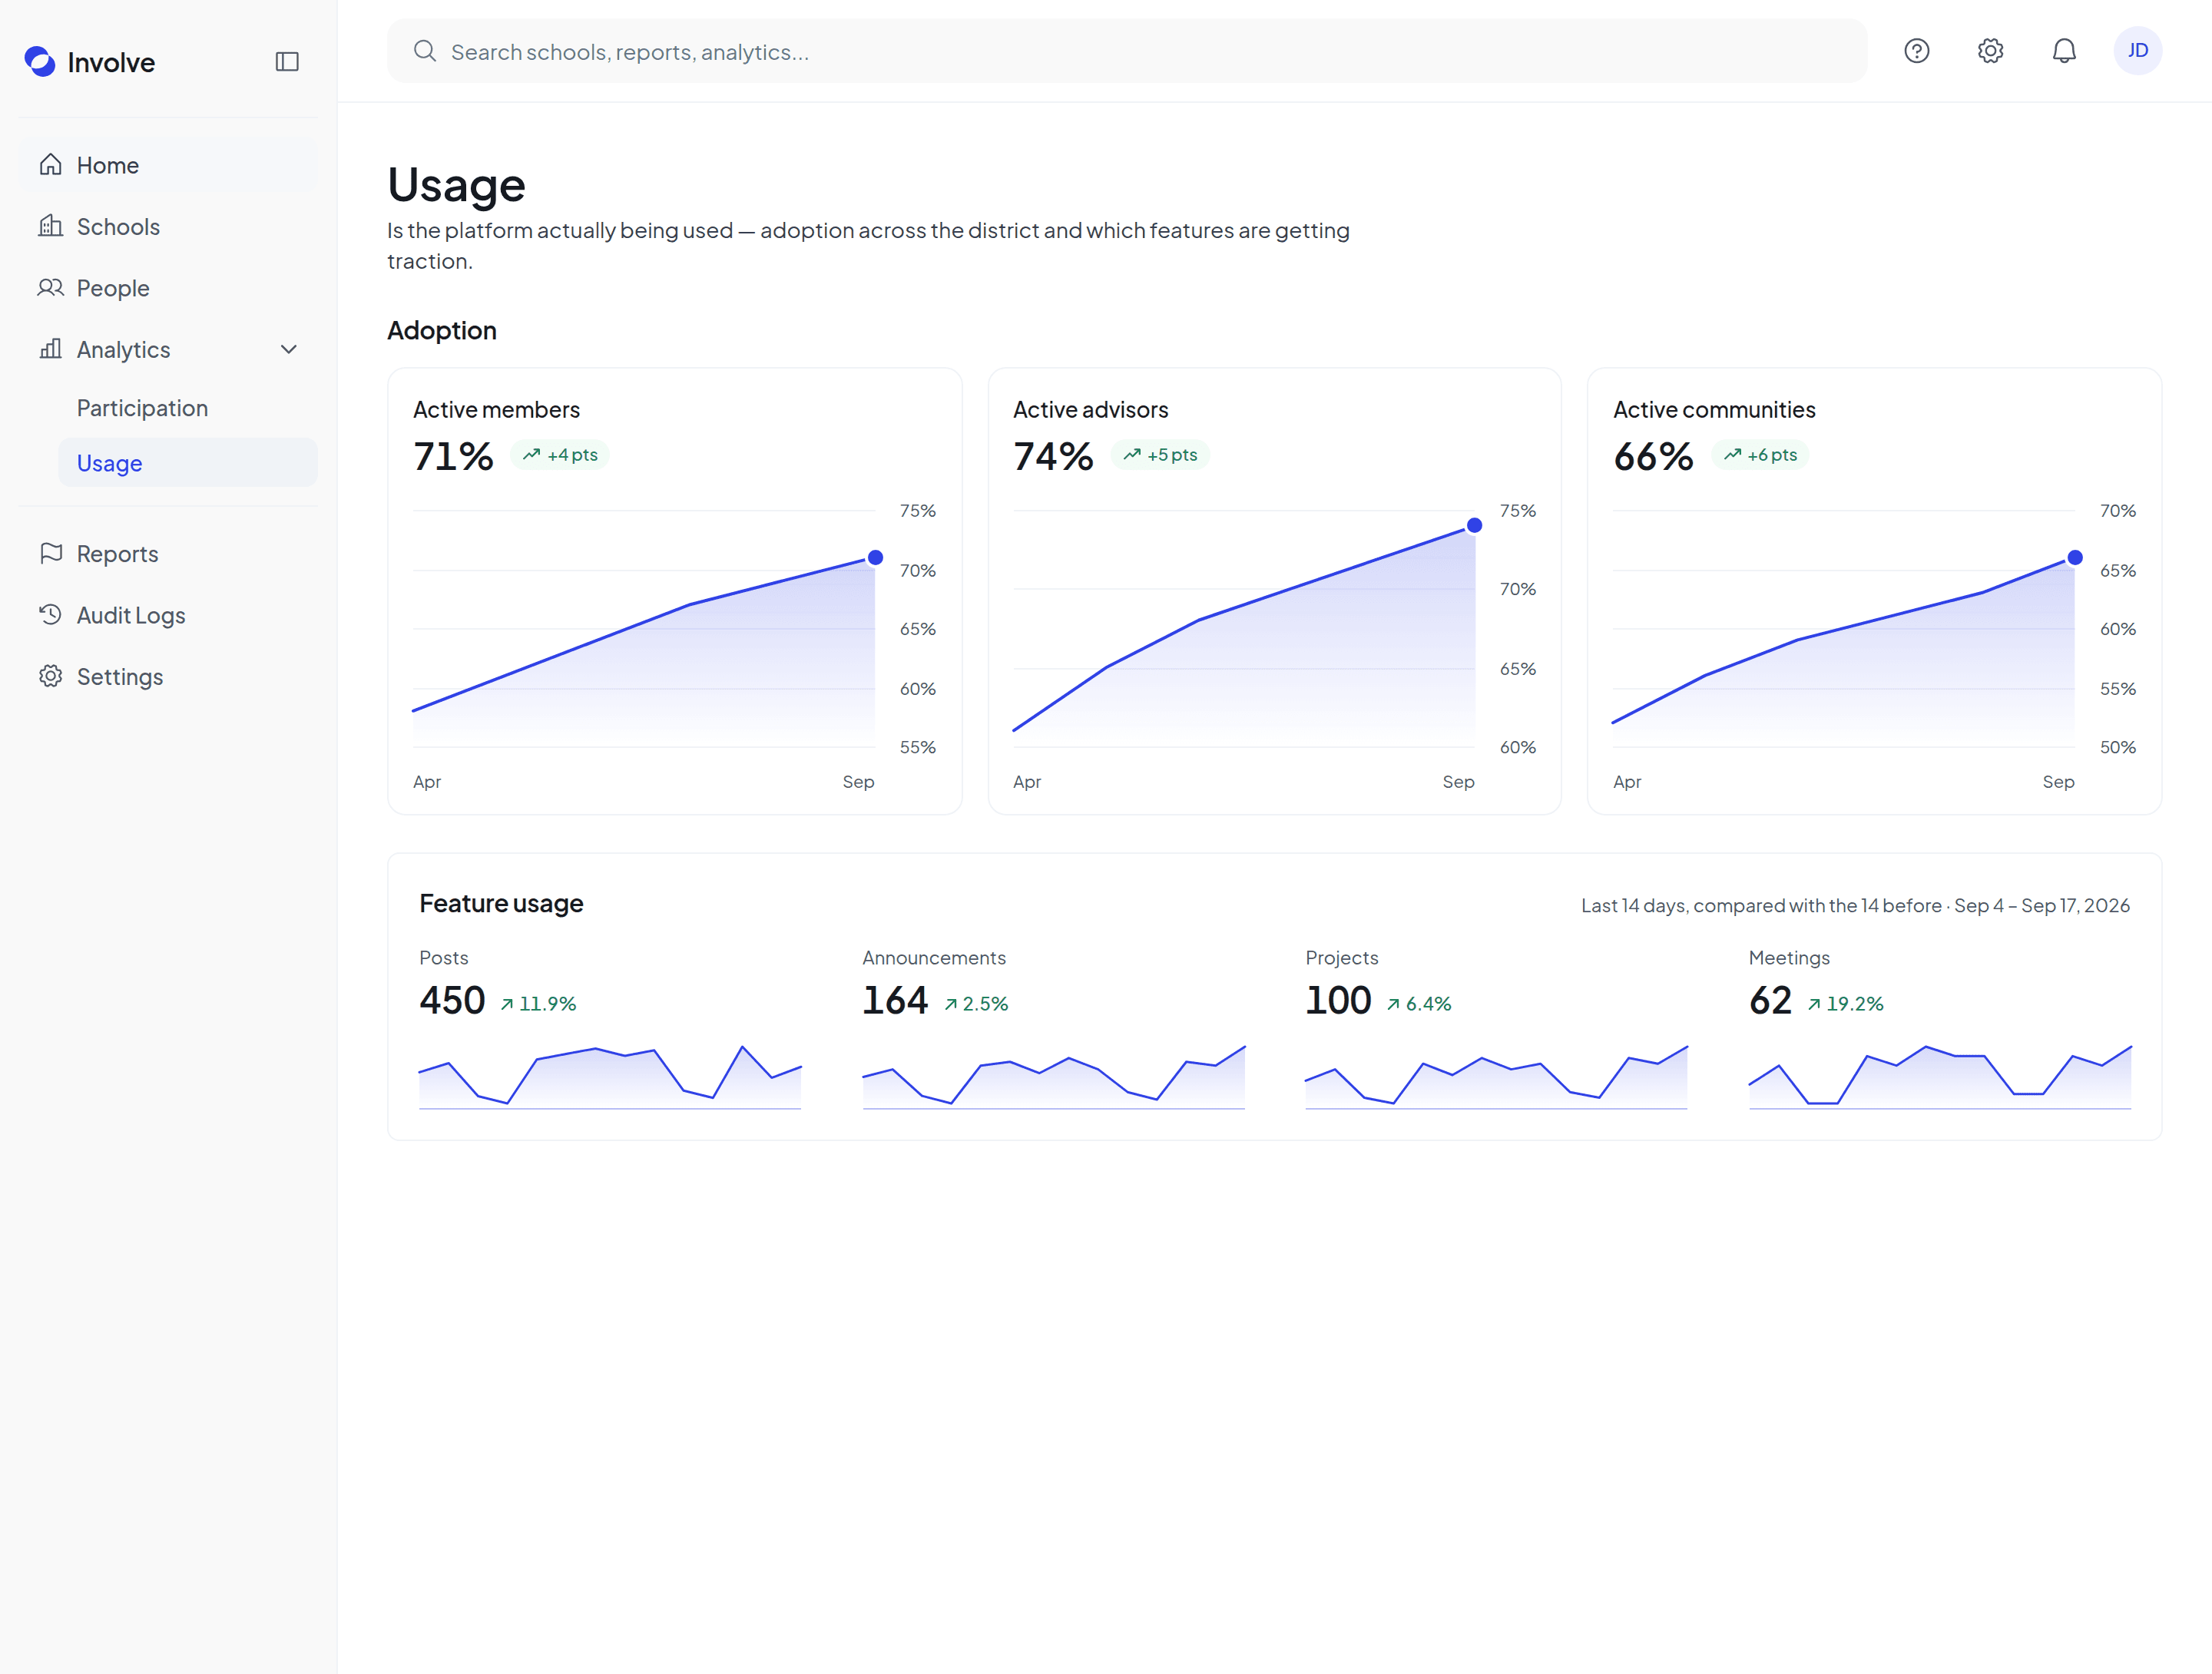
Active members
How many of your members are using Involve.
Active advisors
How many advisors are running their clubs on it.
Active communities
How many clubs and activities are live.
Feature usage
Posts, announcements, projects and meetings.
Participation data that comes from running a club, not extra paperwork.
Where it comes from
Advisors take attendance and verify students’ hours as part of running their club. That record is what feeds your district’s analytics. Nobody enters it twice.
Why these measures
We measure duration, intensity and engagement because they’re the dimensions the Texas Education Agency’s 2022 study of extracurricular participation found most closely associated with better outcomes for students.1
98–100%
participation in Texas districts that made it a deliberate priority. Districts without one ranged from 42% to 90%.1 Those are the study’s figures, not results from Involve.
Texas estimated that collecting this data by hand would cost the state $66.9 million over five years. With Involve, it comes from the clubs’ own records.1
1 Texas Education Agency, Extracurricular and Cocurricular Student Activity Accountability Indicator Study, report to the 88th Texas Legislature, December 2022. Read the report (PDF).
Reports in one place. Every action on the record.
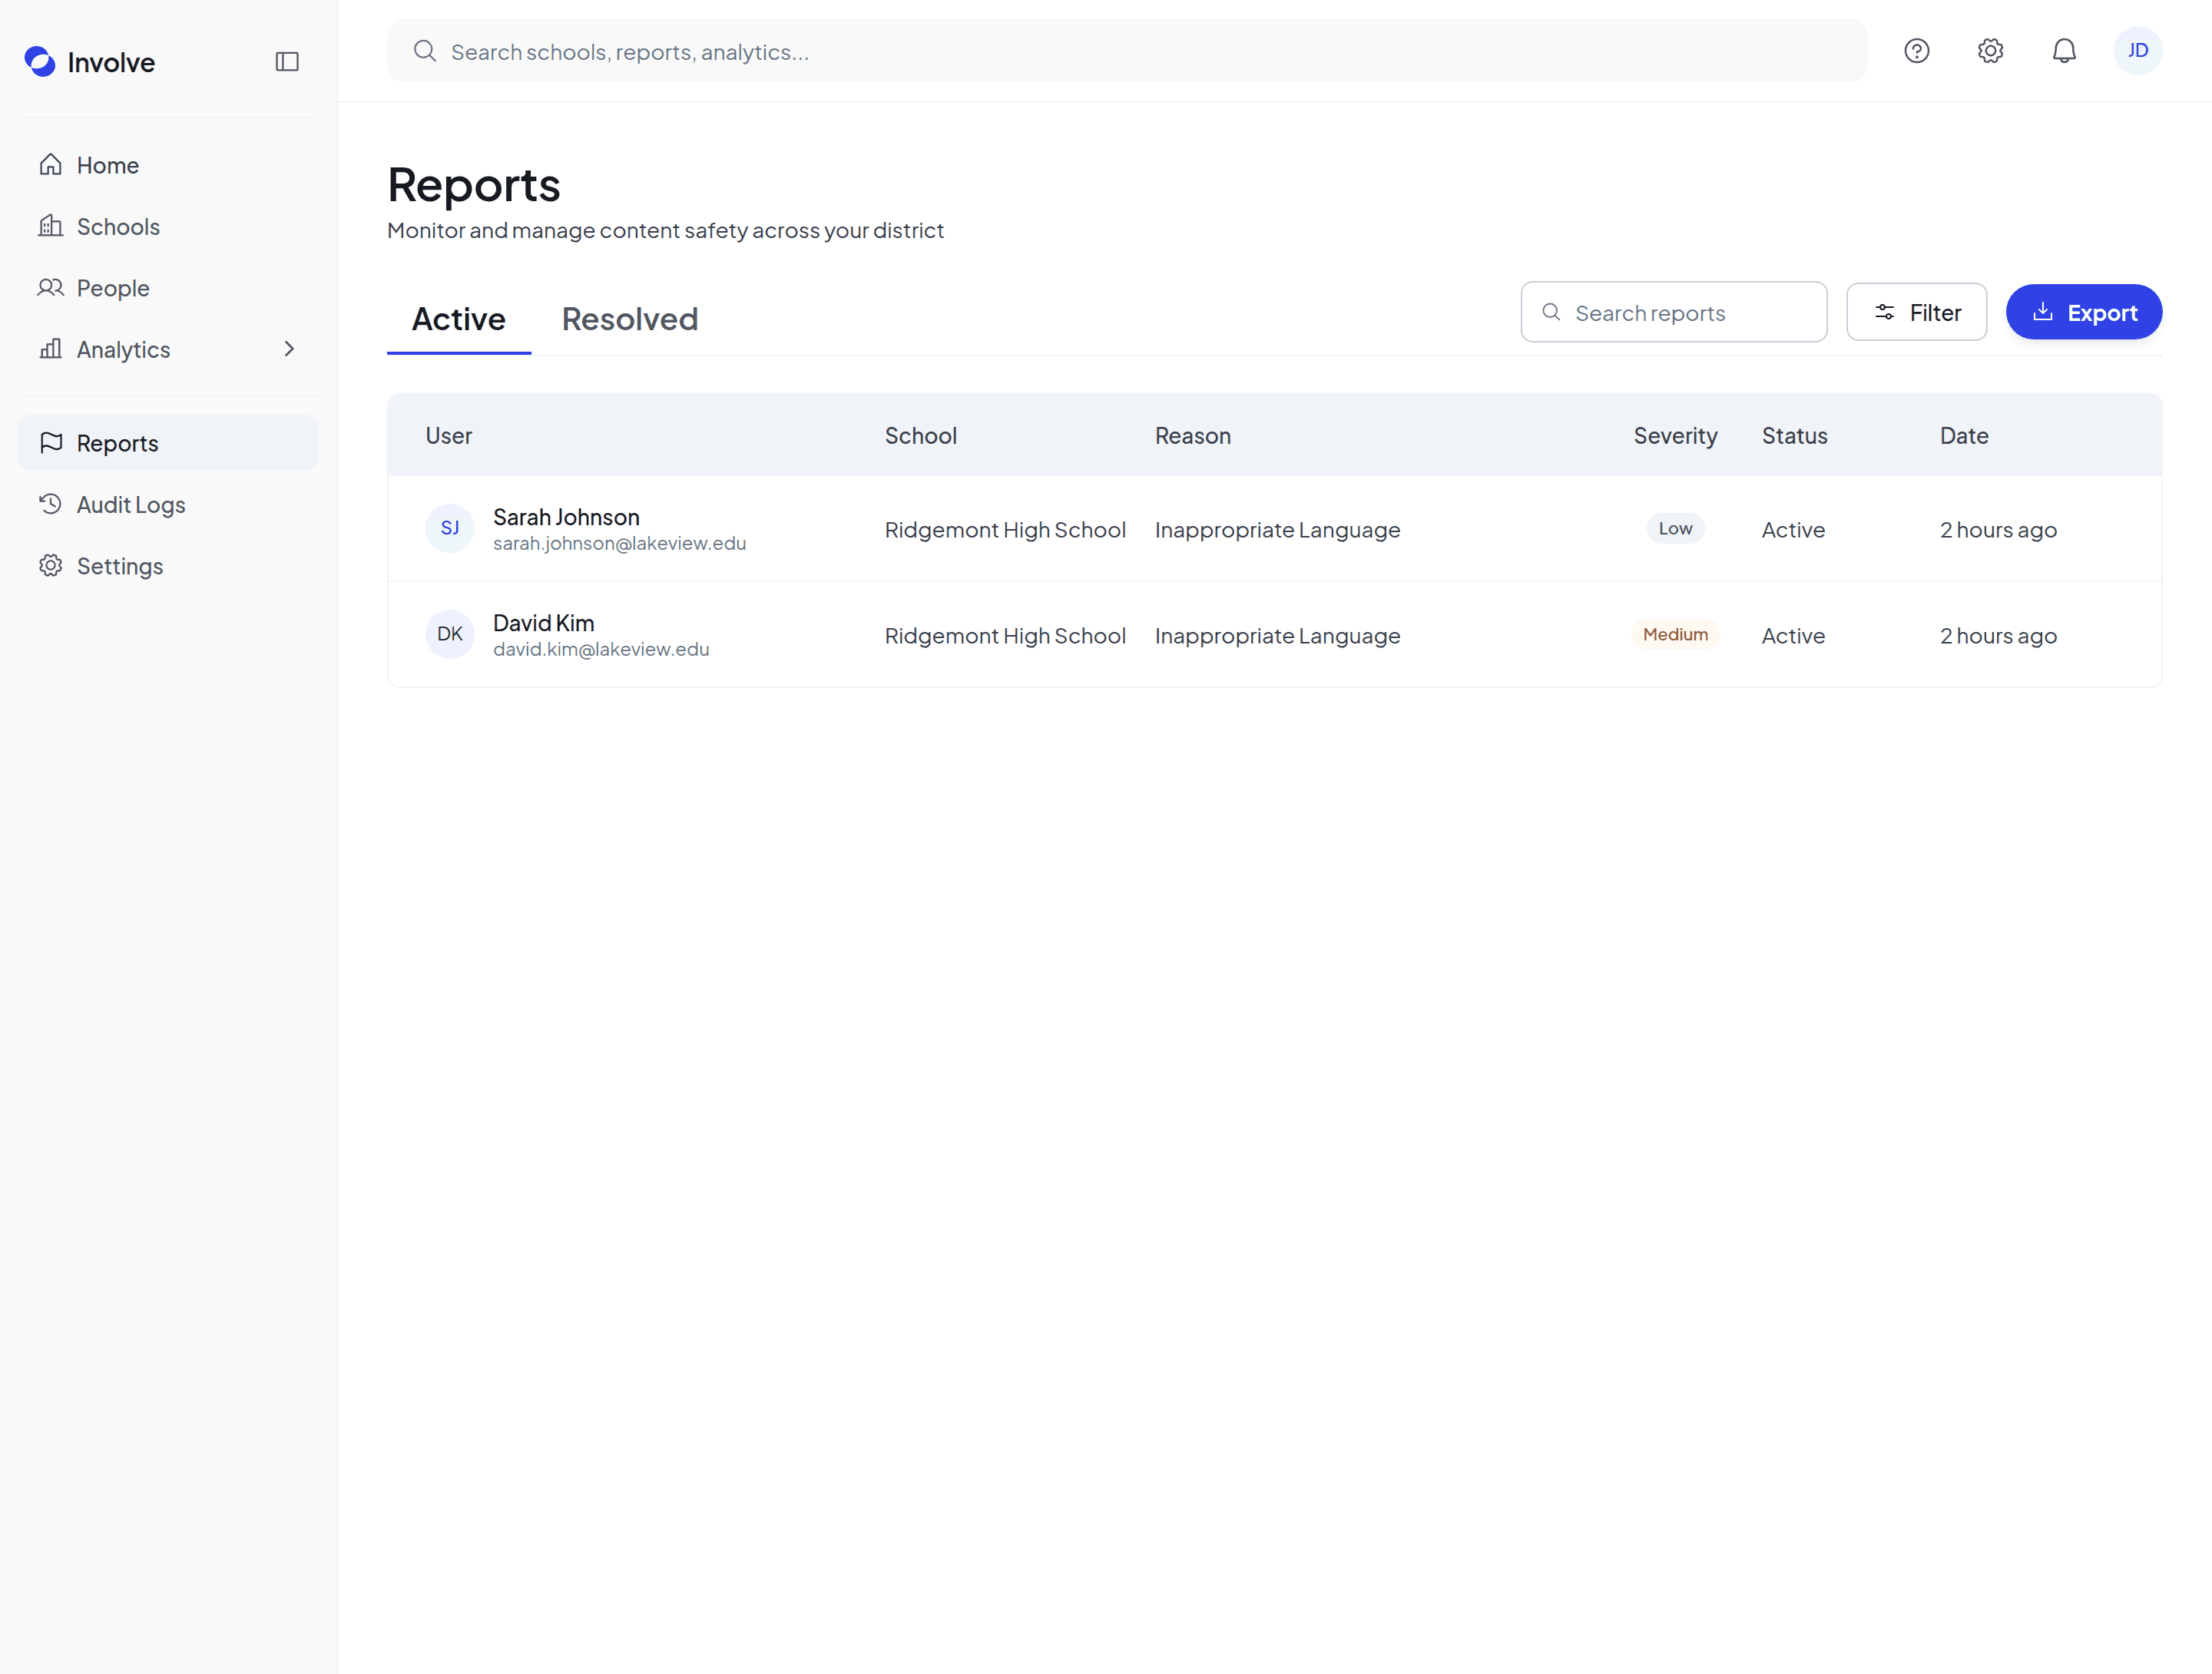
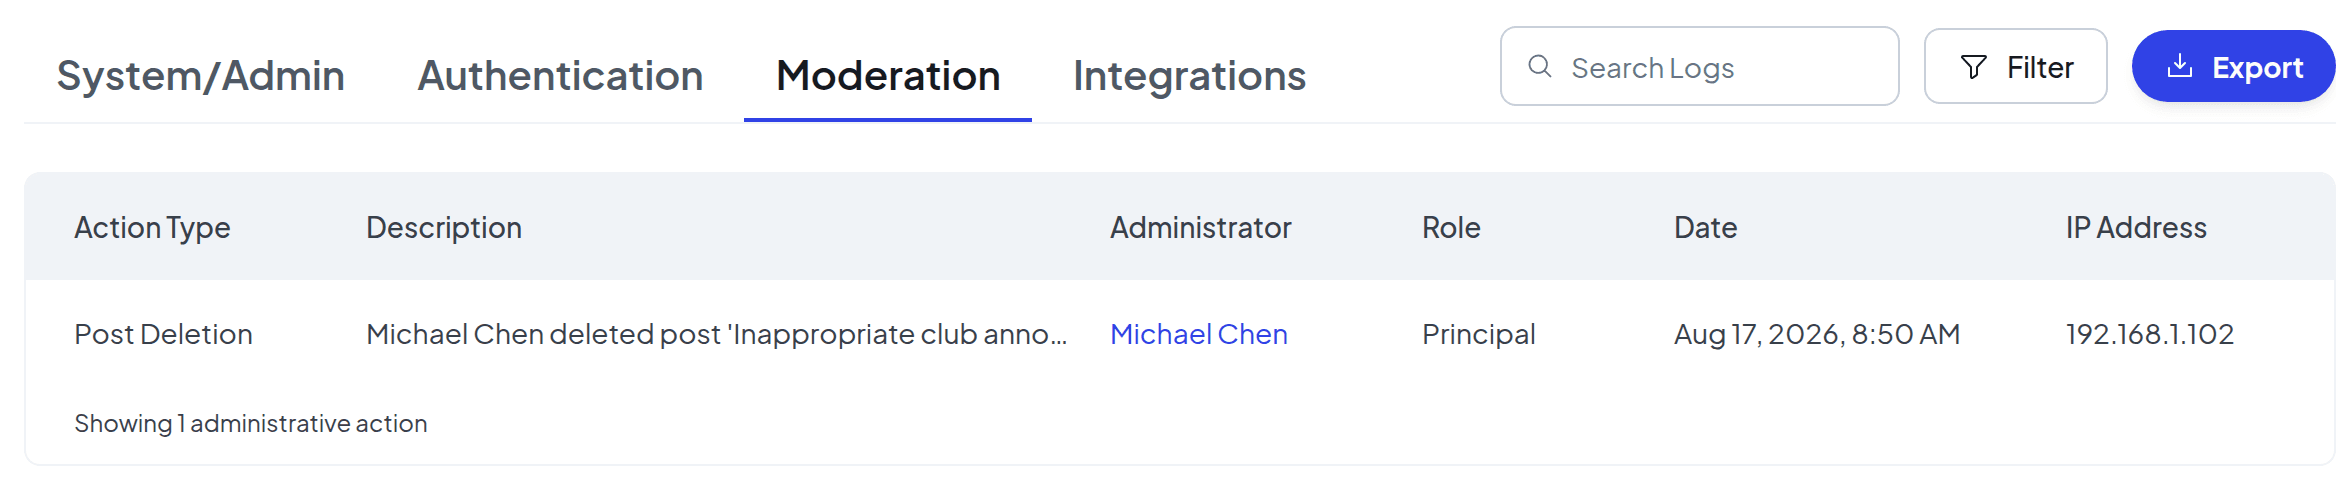
Students can report a bio, a post or a comment and choose why. Every report lands in one place, and an admin can remove the item without leaving Involve. The audit log records who took each action.
The reporter sets the severity
They choose the reason when they report, so the most serious reports are easy to find first.
Schools and the district see the same report
At the same time. A school sees only its own.
Every action is recorded
The audit log shows who acted, and when.
Set up in a few steps, school by school.
Step 1: Connect your school accounts
Your schools appear automatically.
Step 2: Give each school an owner
They run the setup for their school.
Step 3: Bring in the clubs
Schools import their clubs and invite their advisors.